Figure 8
Download original image
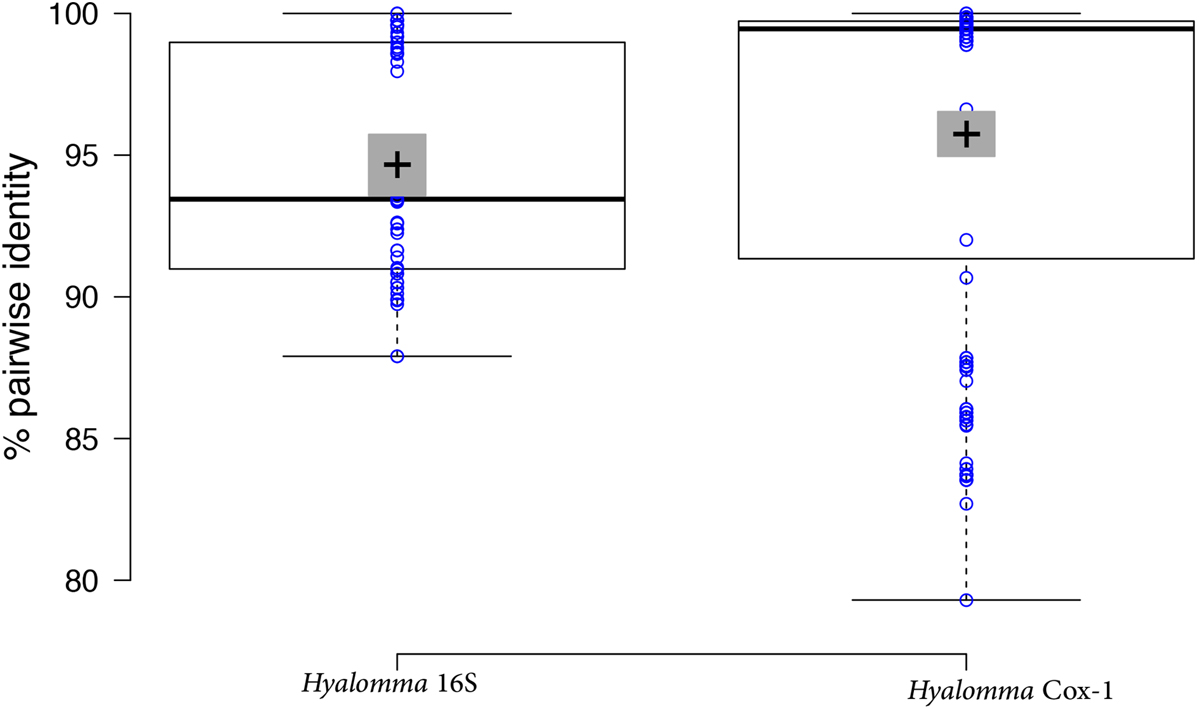
Pairwise percent identities among 16S and Cox1 genes in the Hyalomma species studied. Central lines show the medians; box limits indicate the 25th and 75th percentiles as determined by R software; whiskers extend 1.5 times the interquartile range from the 25th and 75th percentiles, outliers are represented by dots; crosses represent sample means; bars indicate 95% confidence intervals of the means; data points are plotted as open circles. n = 55, 231 sample points.
Current usage metrics show cumulative count of Article Views (full-text article views including HTML views, PDF and ePub downloads, according to the available data) and Abstracts Views on Vision4Press platform.
Data correspond to usage on the plateform after 2015. The current usage metrics is available 48-96 hours after online publication and is updated daily on week days.
Initial download of the metrics may take a while.