Figure 1
Download original image
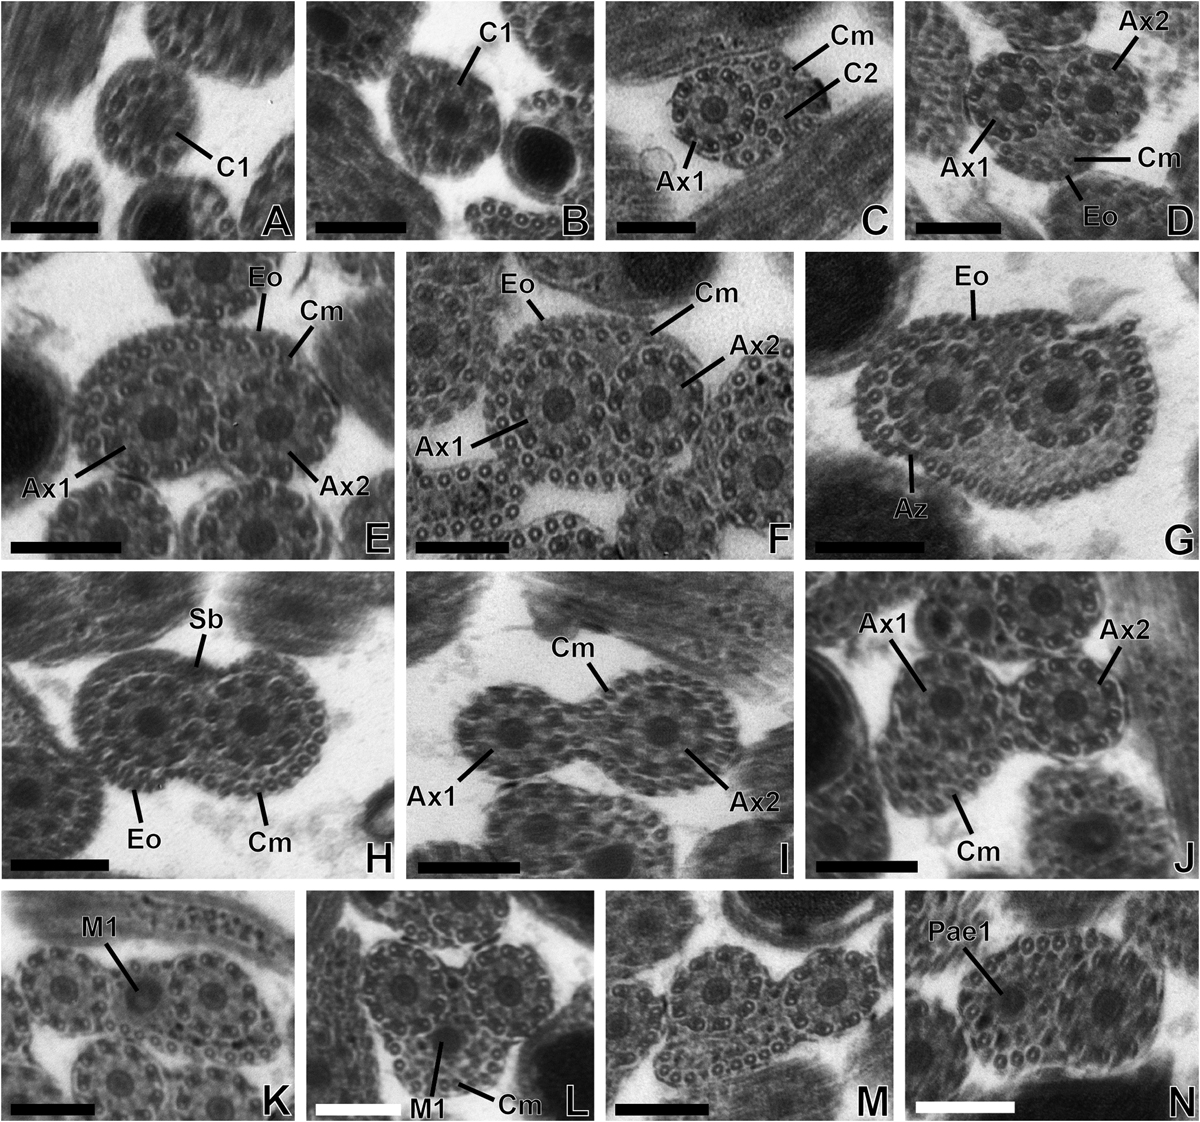
(A–N) Transmission electron micrographs of regions I, II and III of the mature spermatozoon of Tergestia clonacantha. Scale bars = 0.2 μm. (A–C) Cross-sections in the anterior extremity (or region I) of the spermatozoon. (A–B) Cross-sections in the anterior extremity of the spermatozoon with only the centriole (C1) of axoneme 1 (A × 1), cortical microtubules (Cm) and the centriole of axoneme 2 (C2). (C) Cross-section in the anterior extremity of the spermatozoon with axoneme 1, five cortical microtubules, and the centriole of axoneme 2 (C2). (D–H) Cross-sections in region II of the spermatozoon. (D) Cross-section in region II of the spermatozoon with the two axonemes (A × 1 and A × 2), cortical microtubules (Cm), and the external ornamentation of the plasma membrane (Eo). (D–H) Cross-sections in region II of the mature spermatozoon showing the two axonemes, an increasing number of cortical microtubules up to 36 in (G), and the external ornamentation of the plasma membrane and spine-like body (H). (I–N) Cross-sections in region III of the spermatozoon. (I) Cross-sections in region III of the mature spermatozoon showing only the two axonemes, a row of 23 cortical microtubules next to axoneme 2, a decrease of cortical microtubules up to 12 (J), the appearance of the first mitochondrion (M1) (K), a progressive decrease of cortical microtubules (L–M) and the disorganization of axoneme 1 (Pae1) (N).
Current usage metrics show cumulative count of Article Views (full-text article views including HTML views, PDF and ePub downloads, according to the available data) and Abstracts Views on Vision4Press platform.
Data correspond to usage on the plateform after 2015. The current usage metrics is available 48-96 hours after online publication and is updated daily on week days.
Initial download of the metrics may take a while.