Figure 1
Download original image
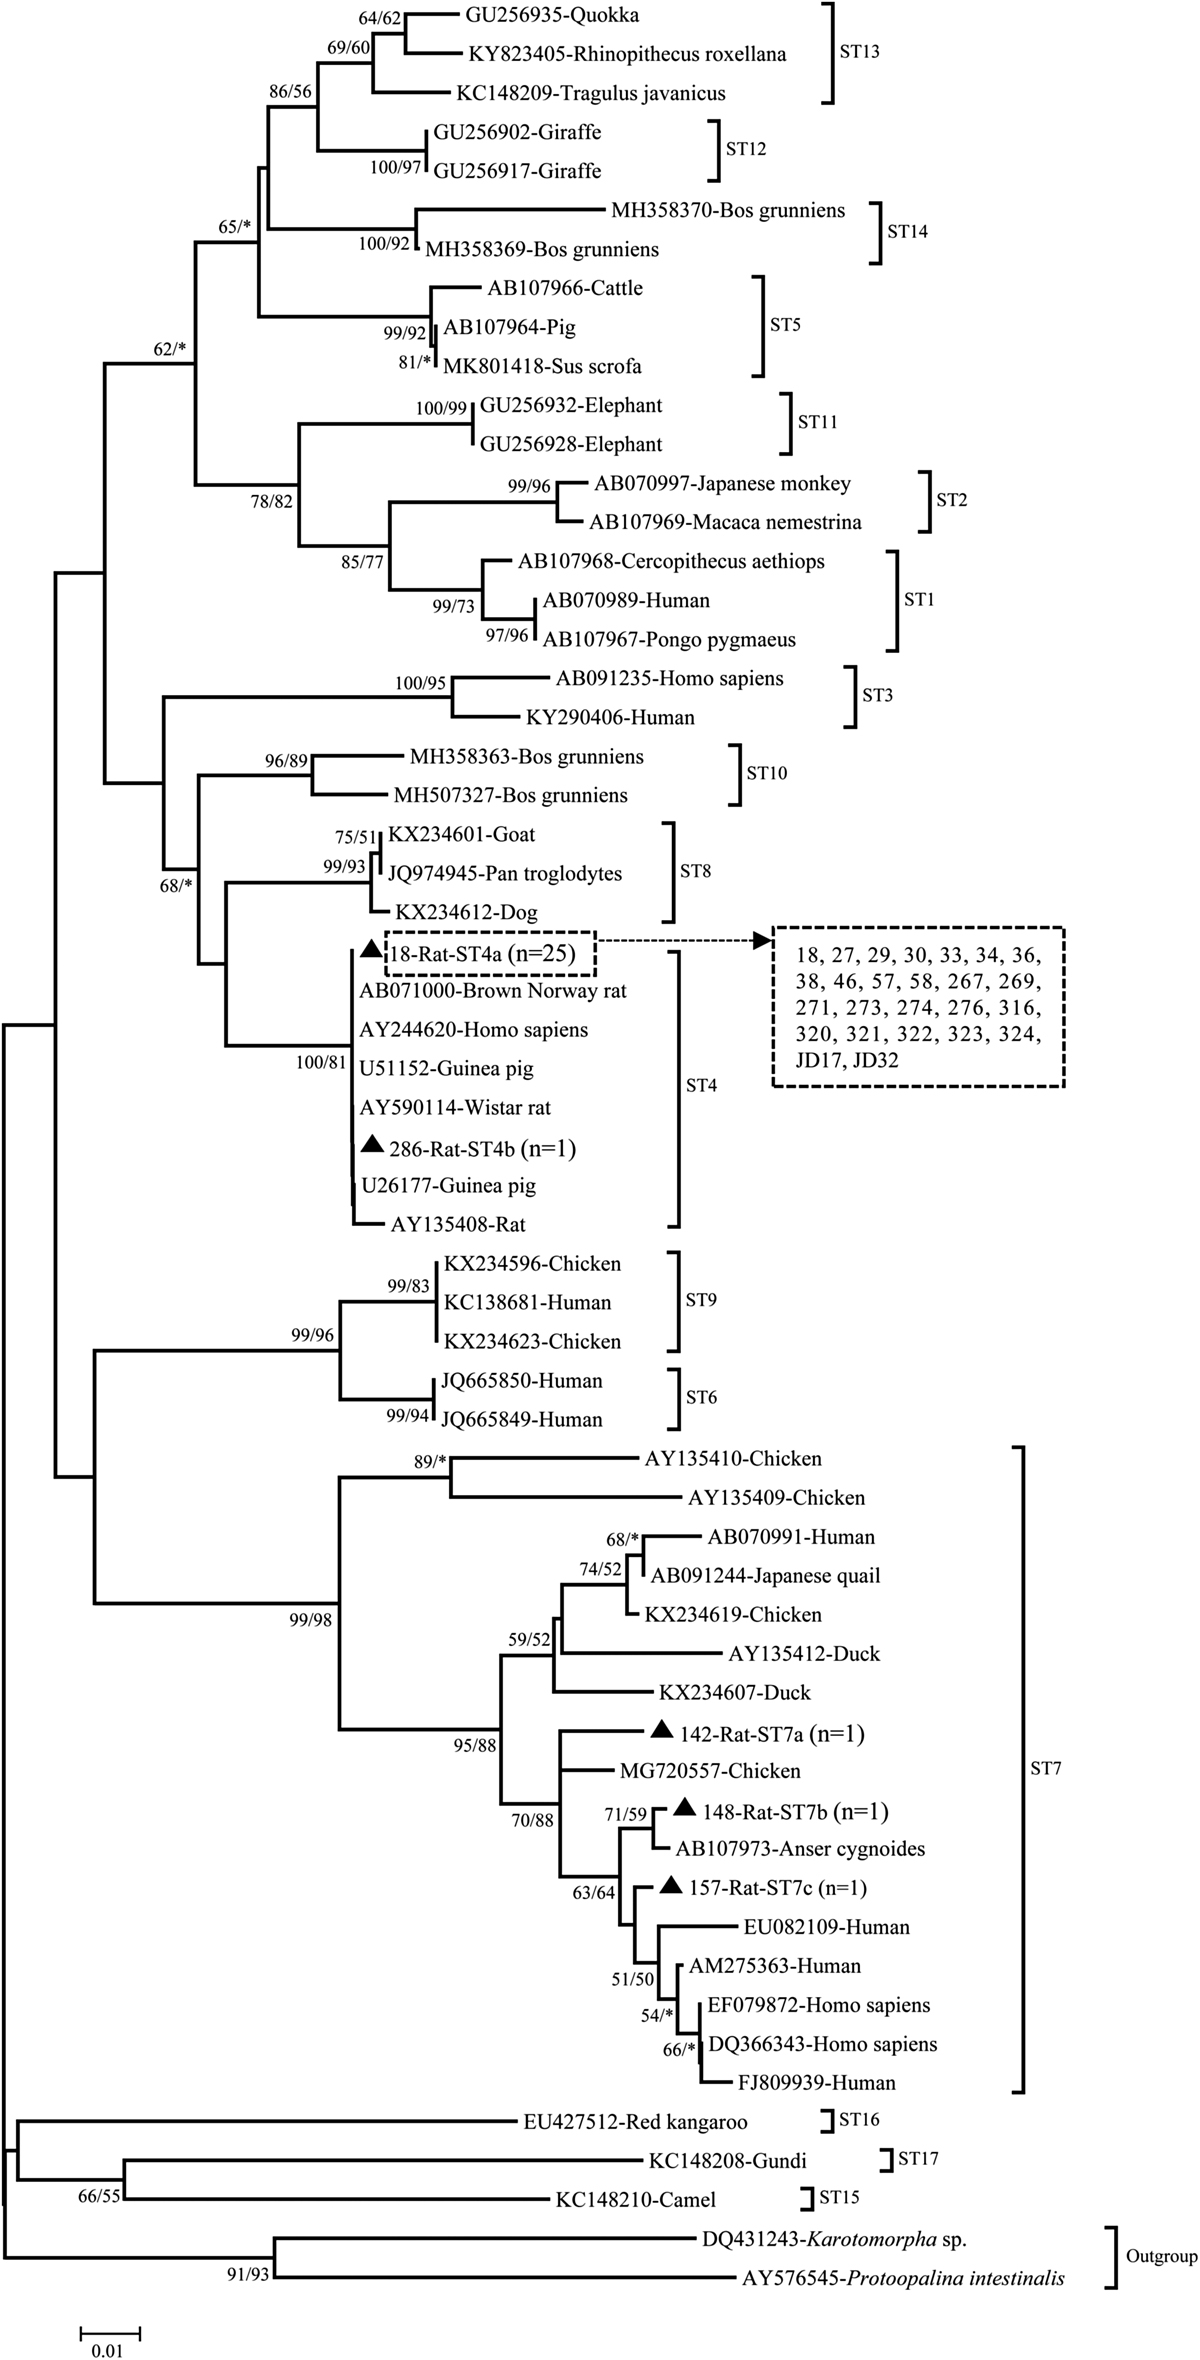
Phylogenetic relationships of the Blastocystis sp. subtypes identified in the present study and other reference subtypes. The phylogeny was inferred with both neighbor-joining (NJ) and maximum likelihood (ML) analysis. Evolutionary distances were computed using the maximum composite likelihood method with rate variation among sites modeled using a gamma distribution (shape parameter = 0.5). The percentage of trees that clustered together based on a bootstrap test (1000 replicates) and posterior probabilities (expressed as a percentage) are shown beside the branch nodes. An asterisk indicates a value of less than 50%; if both analyses produced values lower than 50%, no values are shown for that node. The genotypes detected in present study in bold are shown with filled triangles.
Current usage metrics show cumulative count of Article Views (full-text article views including HTML views, PDF and ePub downloads, according to the available data) and Abstracts Views on Vision4Press platform.
Data correspond to usage on the plateform after 2015. The current usage metrics is available 48-96 hours after online publication and is updated daily on week days.
Initial download of the metrics may take a while.