Figure 3
Download original image
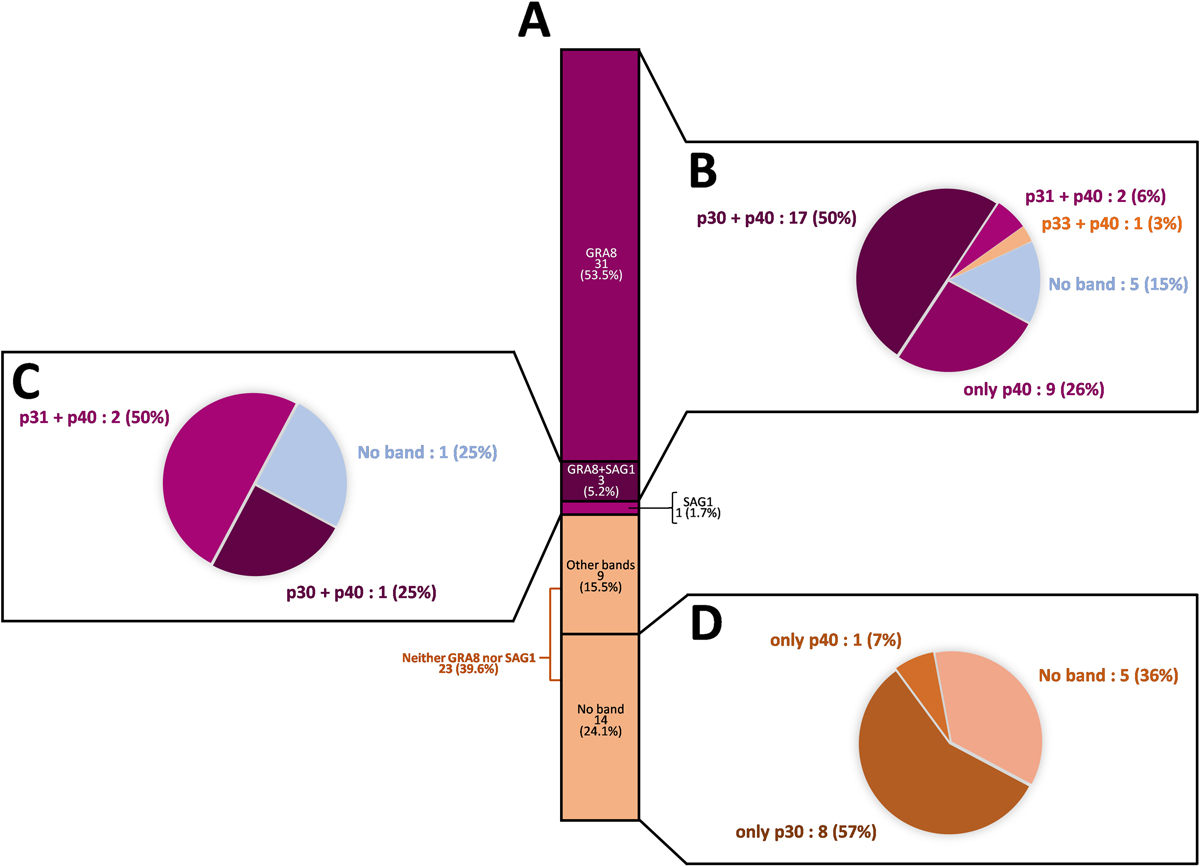
Description of the immunoblot profiles of the 58 negative LDBio® tests (true false-positives with Architect®). (A) Proportion of recomLine® profiles positive for GRA8, SAG1, GRA8+SAG1, other bands or no band, among the 58 negative LDBio® tests. (B) LDBio® profiles of the GRA8-positive recomLine® profiles. (C) LDBio® profiles of the SAG1-positive recomLine® profiles. (D) LDBio® profiles of the “no band” recomLine® profiles.
Current usage metrics show cumulative count of Article Views (full-text article views including HTML views, PDF and ePub downloads, according to the available data) and Abstracts Views on Vision4Press platform.
Data correspond to usage on the plateform after 2015. The current usage metrics is available 48-96 hours after online publication and is updated daily on week days.
Initial download of the metrics may take a while.