Figure 5
Download original image
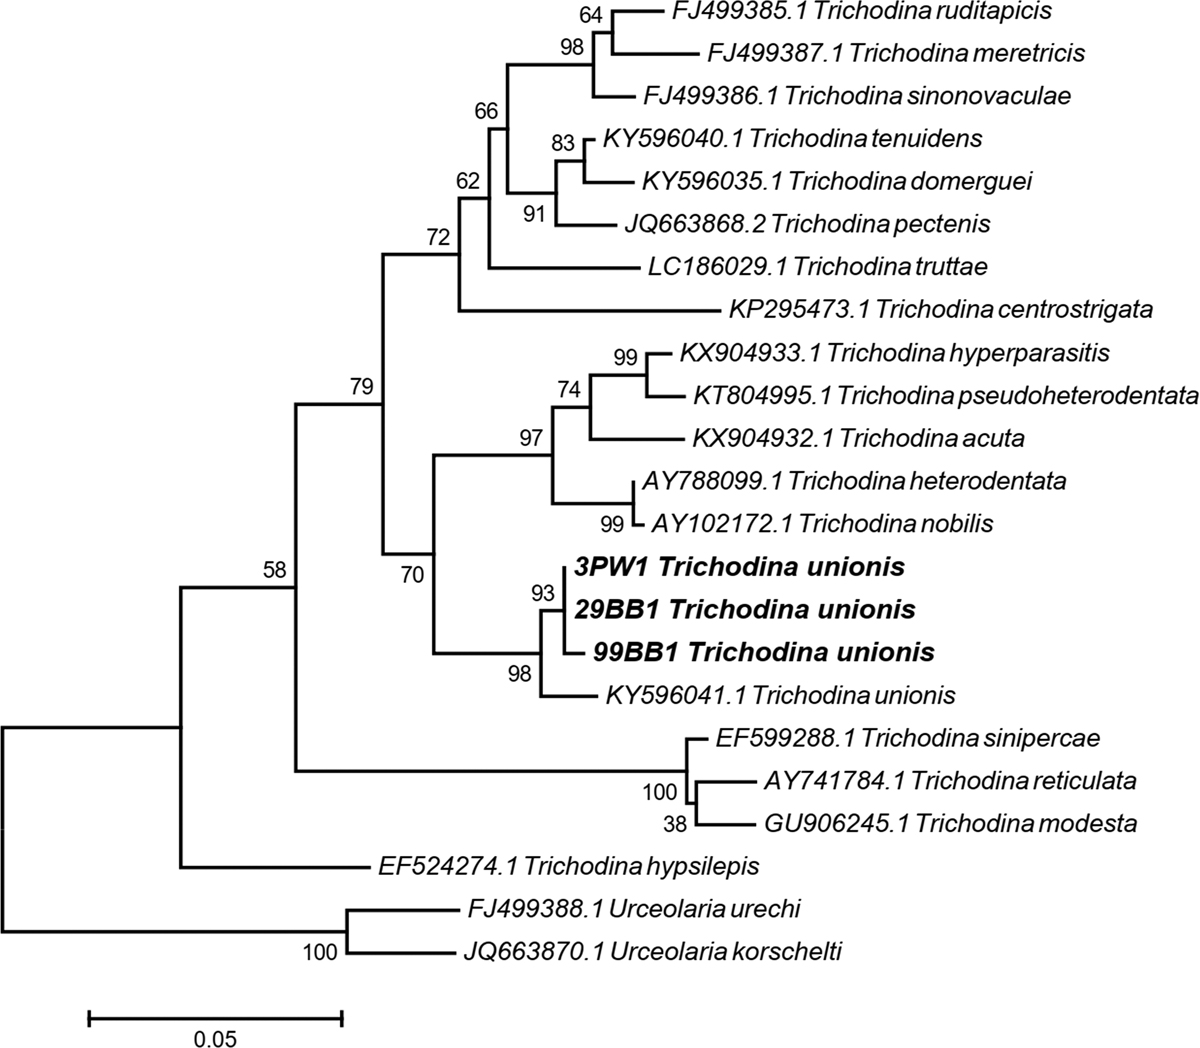
The rooted phylogenetic tree of the trichodinids from the partial 18S rRNA region using the maximum likelihood method. Numbers at each node represent maximum likelihood bootstrap values from 10,000 replicates. The bold taxa refer to trichodinids in this study. The scale bar was drawn as branch lengths measured in the number of substitutions per site of nucleotides.
Current usage metrics show cumulative count of Article Views (full-text article views including HTML views, PDF and ePub downloads, according to the available data) and Abstracts Views on Vision4Press platform.
Data correspond to usage on the plateform after 2015. The current usage metrics is available 48-96 hours after online publication and is updated daily on week days.
Initial download of the metrics may take a while.