Figure 4

Download original image
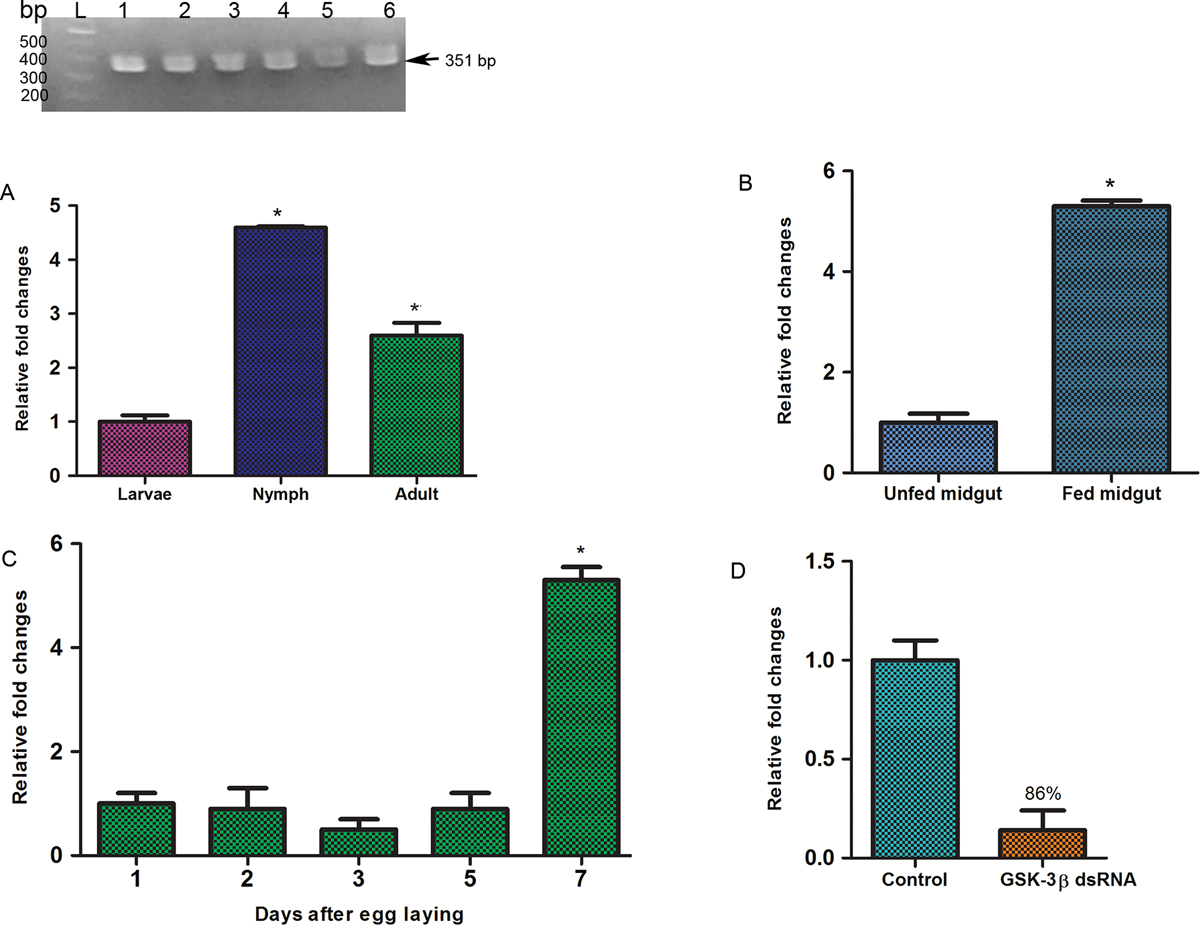
Transcriptional profiles of GSK-3β at different developmental stages. (A) RT-PCR shows presence of GSK-3β in all developmental stages. Lane L indicates 100 bp DNA ladder; lanes 1, 2, 3, 4, 5 and 6 represent GSK-3β present in egg, larva, nymph, adult, unfed midgut and fed midgut, respectively; (B) GSK-3β expression in larva, nymph, and adult stages; (C) GSK-3β expression in fed and unfed midguts of adult females; (D) Expression at different egg ages; (E) Knockdown of GSK-3β compared with the control group. The asterisk (*) denotes a significant difference compared with the control group as determined by Student’s t-test (p < 0.05) in case of B and D and One-way ANOVA with Bonferroni’s multiple comparison tests in case of A and C (p < 0.05).
Current usage metrics show cumulative count of Article Views (full-text article views including HTML views, PDF and ePub downloads, according to the available data) and Abstracts Views on Vision4Press platform.
Data correspond to usage on the plateform after 2015. The current usage metrics is available 48-96 hours after online publication and is updated daily on week days.
Initial download of the metrics may take a while.


