Figure 6
Download original image
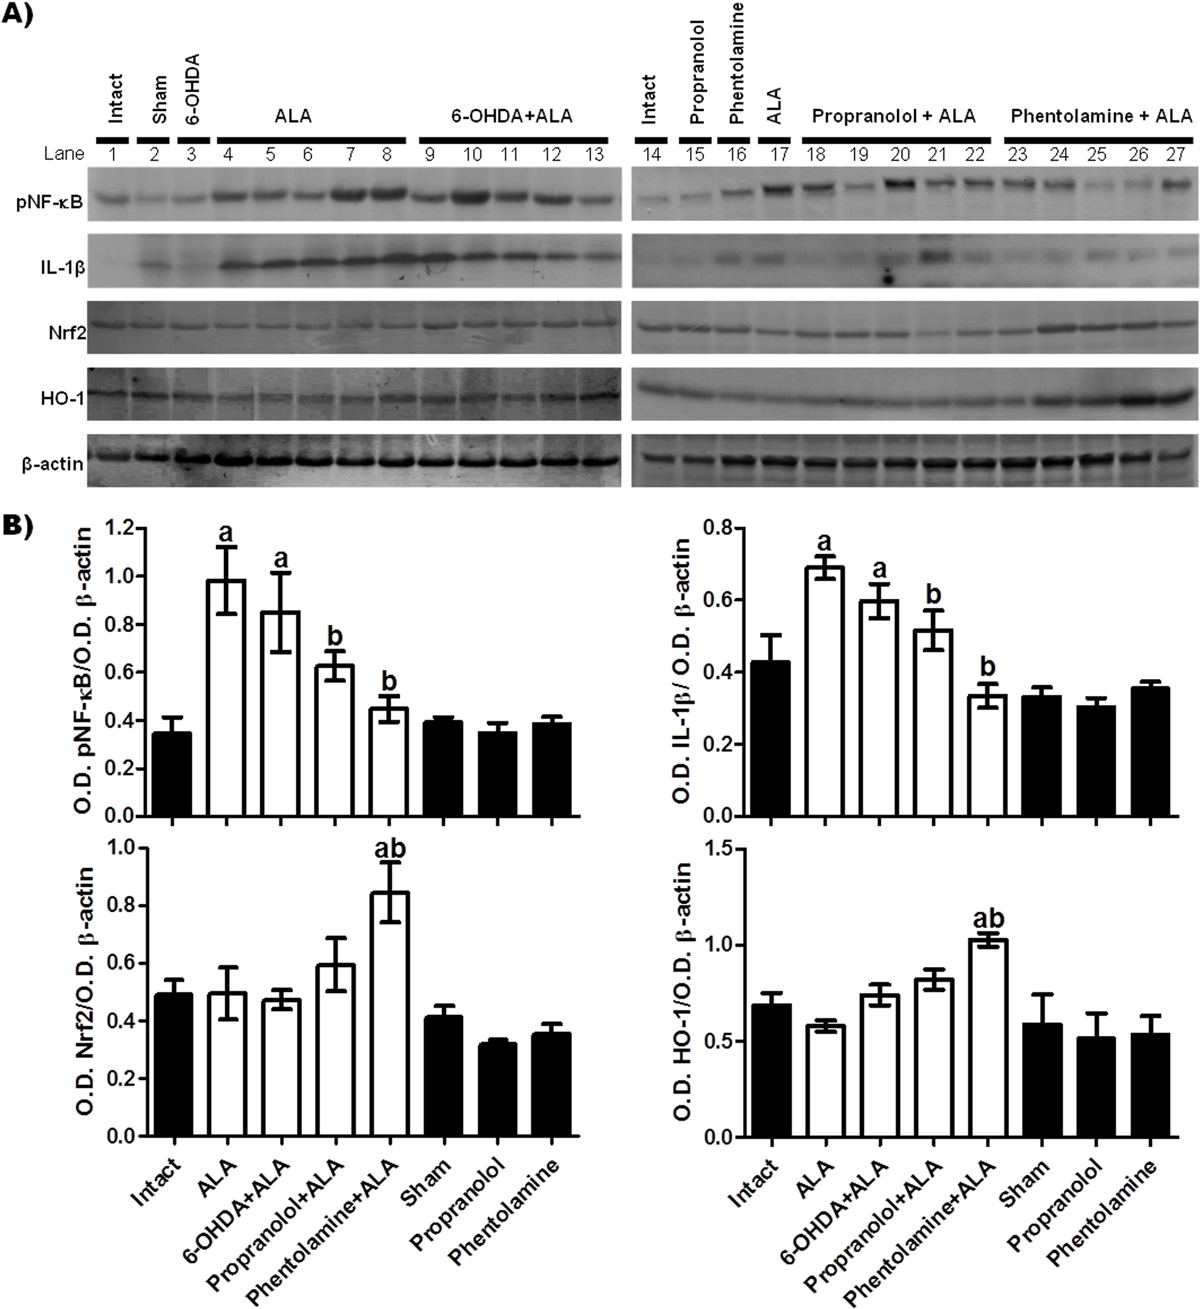
Effect of α and β-AR blockers on the protein expression of pNF-κB, IL-1β, Nrf2 and HO-1 in liver samples taken from amebic abscess areas. (A) Representative images of western blot; each line corresponds to a sample from a different animal, line 1: samples from one animal (intact group), line 2: one animal (sham group), line 3: one sample (6-OHDA group), lines 4 to 8: samples of five animals (ALA group), lines 9 to 13: samples of five hamsters (6-OHDA+ALA group), line 14: one sample (intact group), line 15: one sample (propranolol group), line 16: one sample (phentolamine group), line 17: one sample (ALA group), lines 18 to 22: samples of five animals (propranolol+ALA), lines 23 to 27: samples of five hamsters (phentolamine+ALA). (B) Signal intensities were determined by densitometric analysis of treated blots and values calculated as the ratio of each protein/β-actin. The results shown represent the mean value obtained ± SE of three independent experiments of proteins samples from the 5 hamsters. Corresponding to each protein: a, mean values significantly different from the intact group; and b, mean values significantly different from the ALA group; (p<0.05).
Current usage metrics show cumulative count of Article Views (full-text article views including HTML views, PDF and ePub downloads, according to the available data) and Abstracts Views on Vision4Press platform.
Data correspond to usage on the plateform after 2015. The current usage metrics is available 48-96 hours after online publication and is updated daily on week days.
Initial download of the metrics may take a while.