Figure 1
Download original image
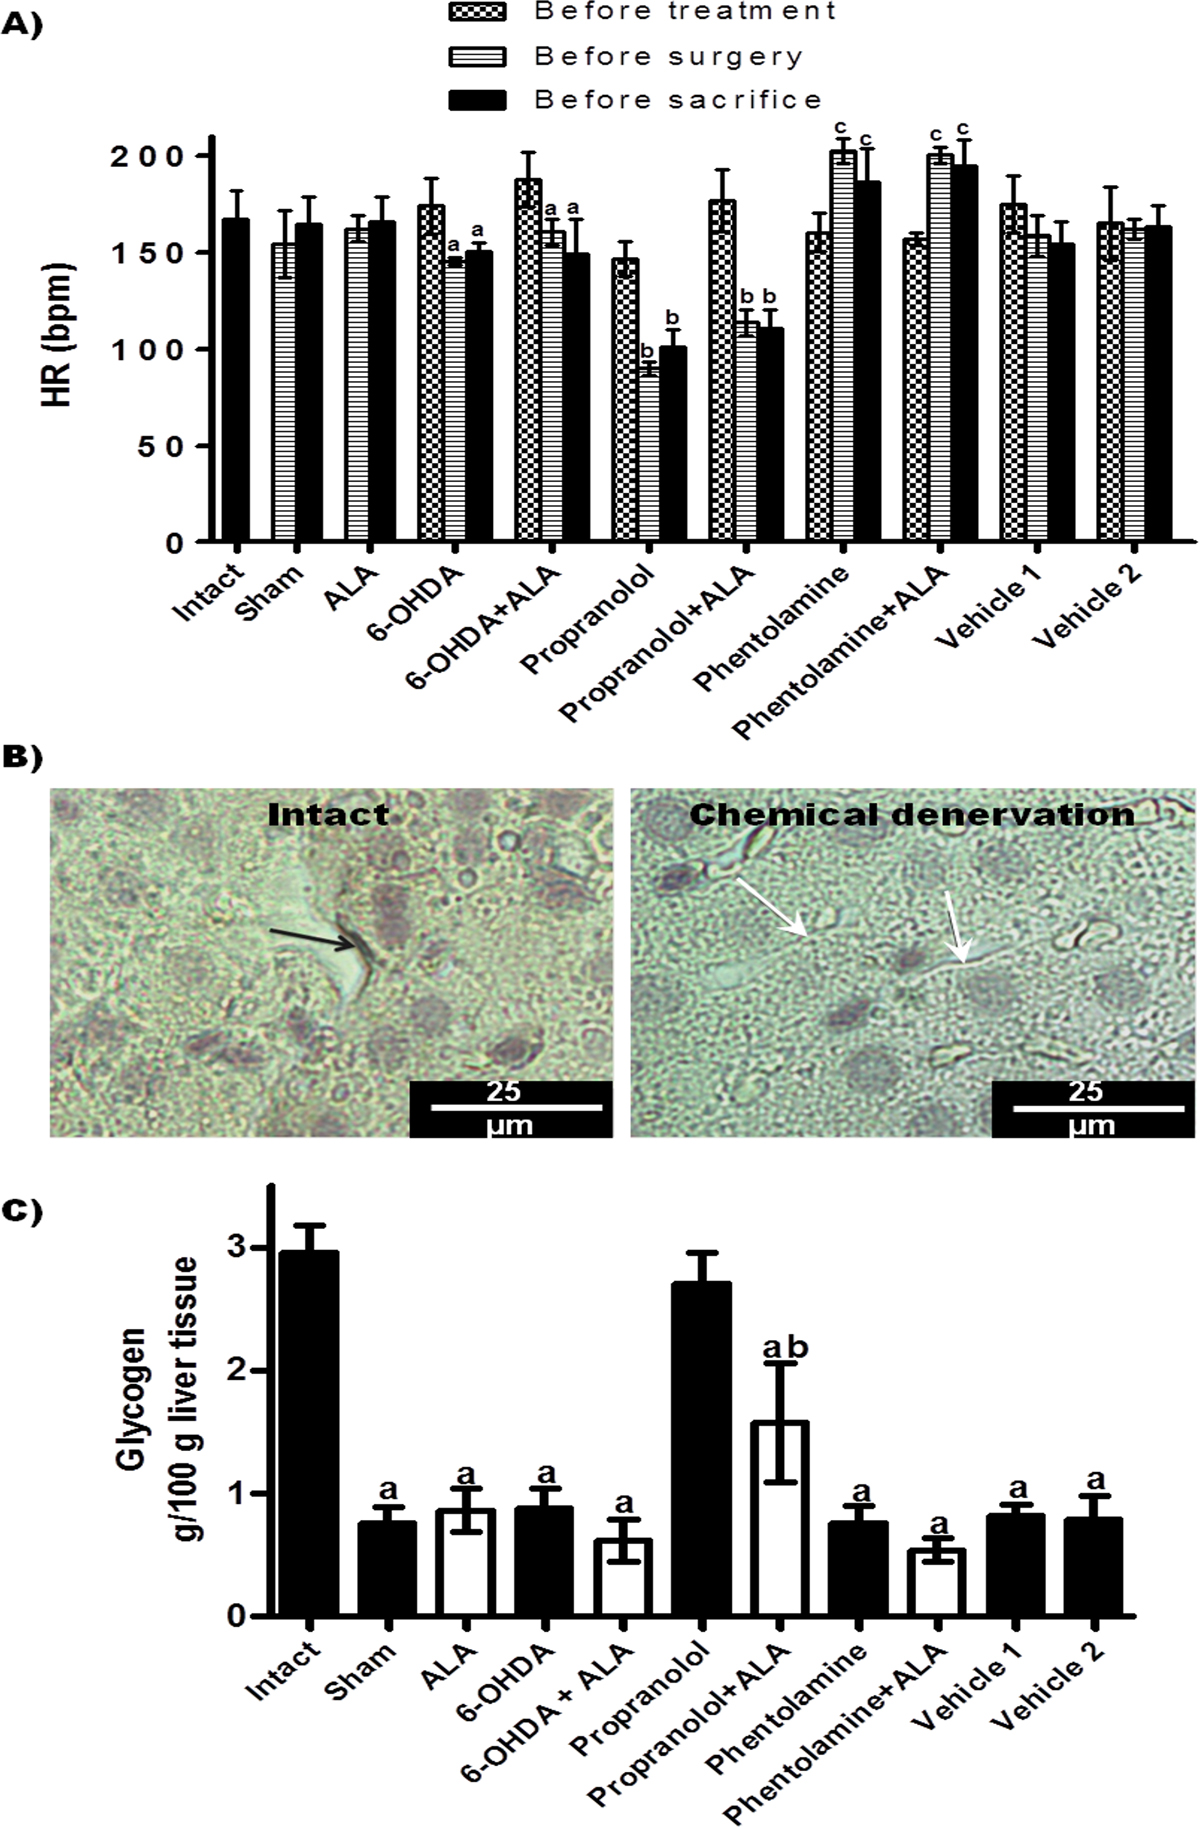
Evaluation of the autonomic nervous system. (A) Heart rate (HR) of experimental groups; each bar represents the mean value of beats per minute (bpm) ± SE (n<5); corresponding to each group, the mean values were significantly different with respect to HR measurement before starting the 6-OHDA (a), propranolol (b) and phentolamine (c) treatments, p<0.05. (B) Immunohistochemistry analysis of hepatic tyrosine hydroxylase (TH) synthesis: representative images of livers from animals with chemical denervation (6-OHDA and 6-OHDA+ALA groups) and healthy animals (sham and intact groups); TH(+) fiber (black arrow) and TH(-) fiber (white arrow). (C) Glycogen content in liver was determined from healthy groups (black bars) and infected with trophozoites (white bars); each bar represents the mean value of experiments performed in duplicate assays ± SE (n<5). a, Mean values significantly different from the intact group, p<0.05; b, mean values significantly different from the propranolol group, p<0.05.
Current usage metrics show cumulative count of Article Views (full-text article views including HTML views, PDF and ePub downloads, according to the available data) and Abstracts Views on Vision4Press platform.
Data correspond to usage on the plateform after 2015. The current usage metrics is available 48-96 hours after online publication and is updated daily on week days.
Initial download of the metrics may take a while.