Figure 4
Download original image
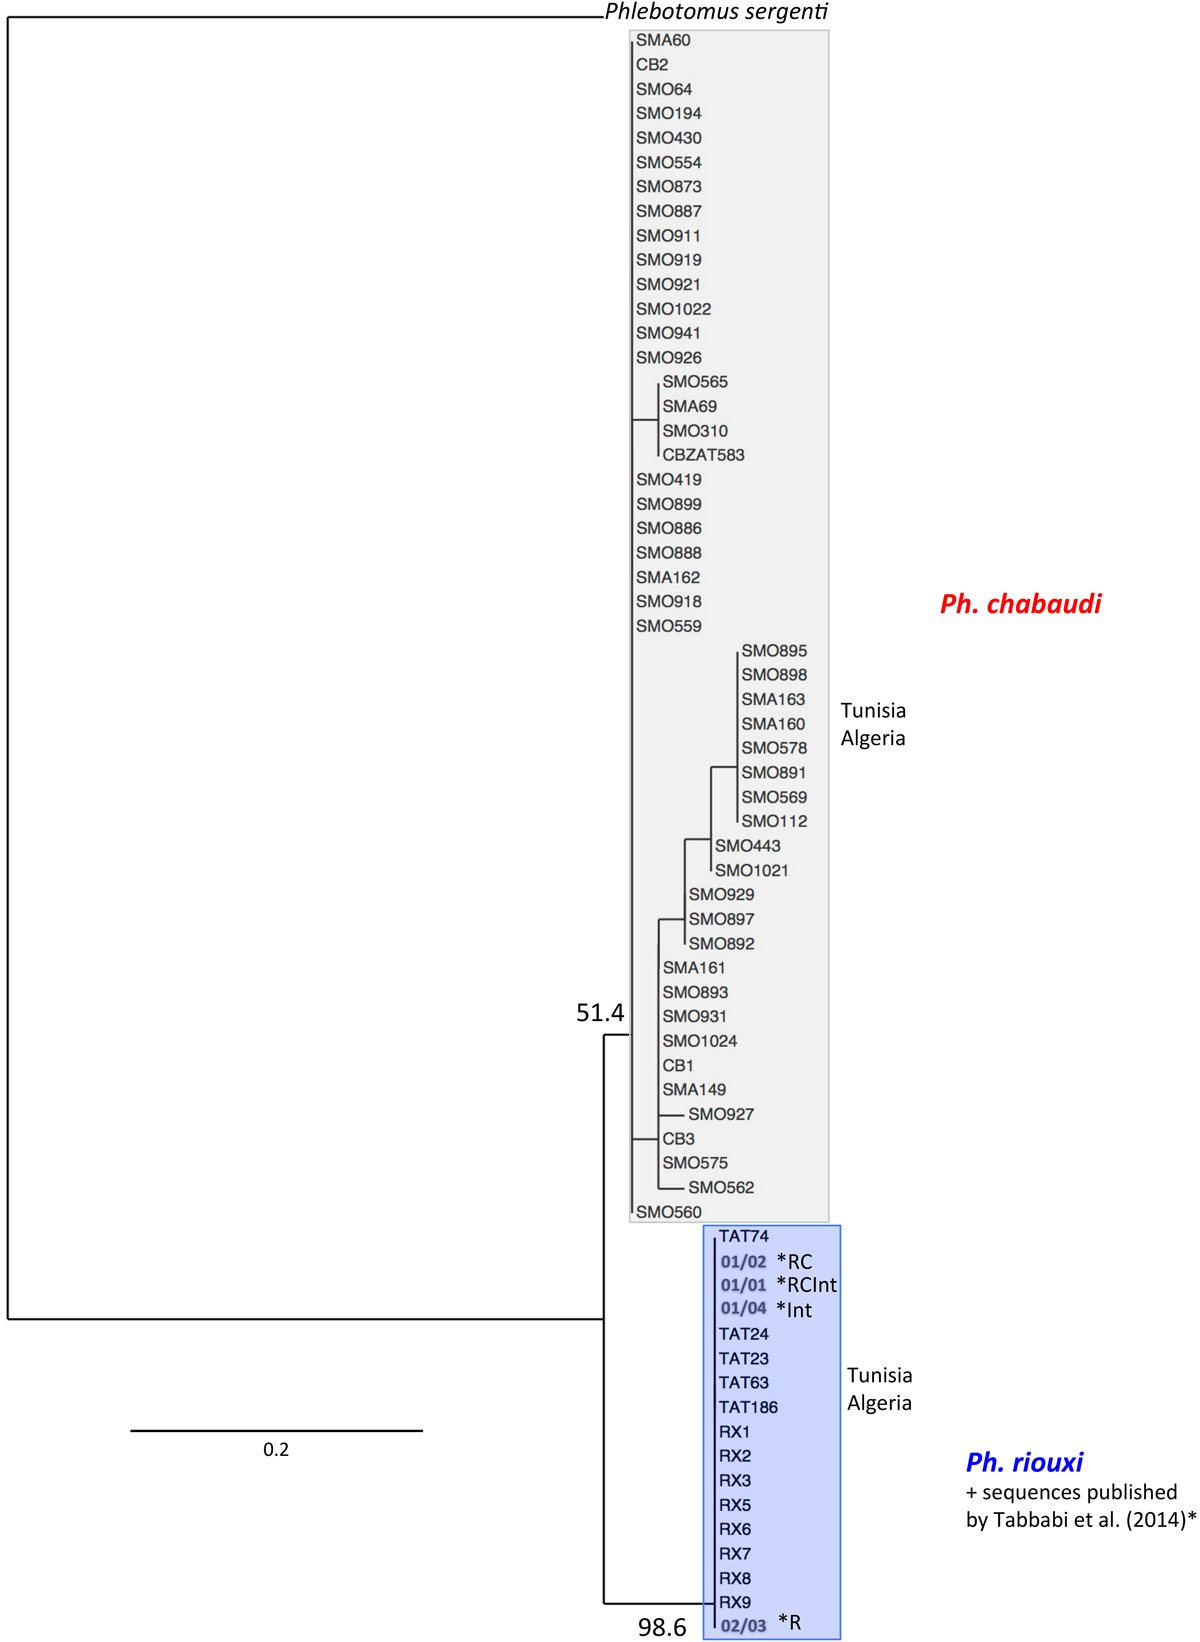
Phylogenetic tree inferred from Phlebotomus chabaudi and Ph. riouxi specimens using the data of elongation factor 1-α gene. Sequences of Ph. chabaudi published by Tabbabi et al. (2014) were added to the analyses. The phylogram results from bootstrapped data sets obtained using the PhyML 3.0 program [21] using the HKY85 [25] + I (proportion of invariant sites) model. The tree was visualized using the TreeDyn program, version 198.3 [7]. Percentages shown above the branches are the frequencies at which a given branch appeared in 500 bootstrap replications. Only bootstrap values higher than 50% on the early branches are shown. A sequence of Ph. sergenti (EF416841) was used as the outgroup. The sequences marked by * were published by Tabbabi et al. (2014); R = sequences found in specimens morphologically characterized as Ph. riouxi. RC = sequences found in specimens morphologically characterized as Ph. chabaudi or Ph. riouxi. Int = sequences found in specimens morphologically characterized as intermediate between Ph. riouxi and Ph. chabaudi. RCint = sequences found in specimens morphologically characterized as Ph. riouxi, Ph. chabaudi and intermediate specimens between the two species.
Current usage metrics show cumulative count of Article Views (full-text article views including HTML views, PDF and ePub downloads, according to the available data) and Abstracts Views on Vision4Press platform.
Data correspond to usage on the plateform after 2015. The current usage metrics is available 48-96 hours after online publication and is updated daily on week days.
Initial download of the metrics may take a while.