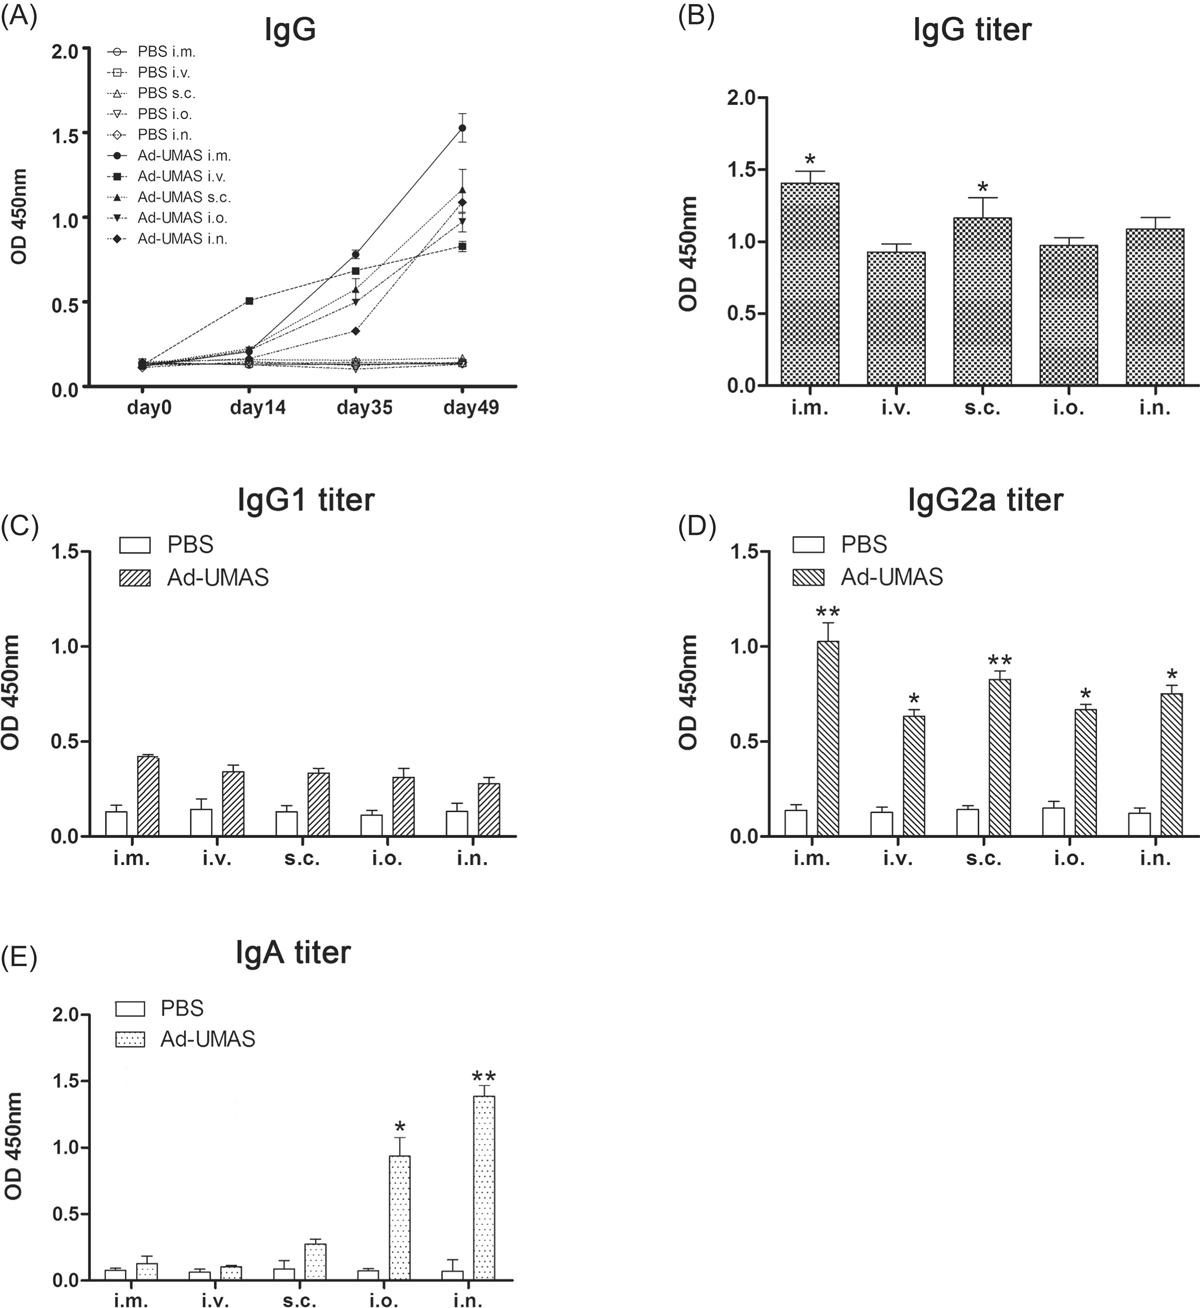
Figure 2.
Download original image
Systemic humoral immune response and local mucosal immune response induced by Ad-UMAS via different immunization routes. (A) IgG antibodies detected in murine serum collected on days 0, 14, 35, and 49. (B) IgG, (C) IgG1, (D) IgG2a, and (E) IgA titers were detected using sera from 4 weeks after the last vaccination. The results are expressed as the mean of the OD450 ± SD and are representative of three experiments. Asterisks mark the significant difference: *p < 0.05; **p < 0.01. Each bar represents the mean OD (± SD, n = 15).
Current usage metrics show cumulative count of Article Views (full-text article views including HTML views, PDF and ePub downloads, according to the available data) and Abstracts Views on Vision4Press platform.
Data correspond to usage on the plateform after 2015. The current usage metrics is available 48-96 hours after online publication and is updated daily on week days.
Initial download of the metrics may take a while.