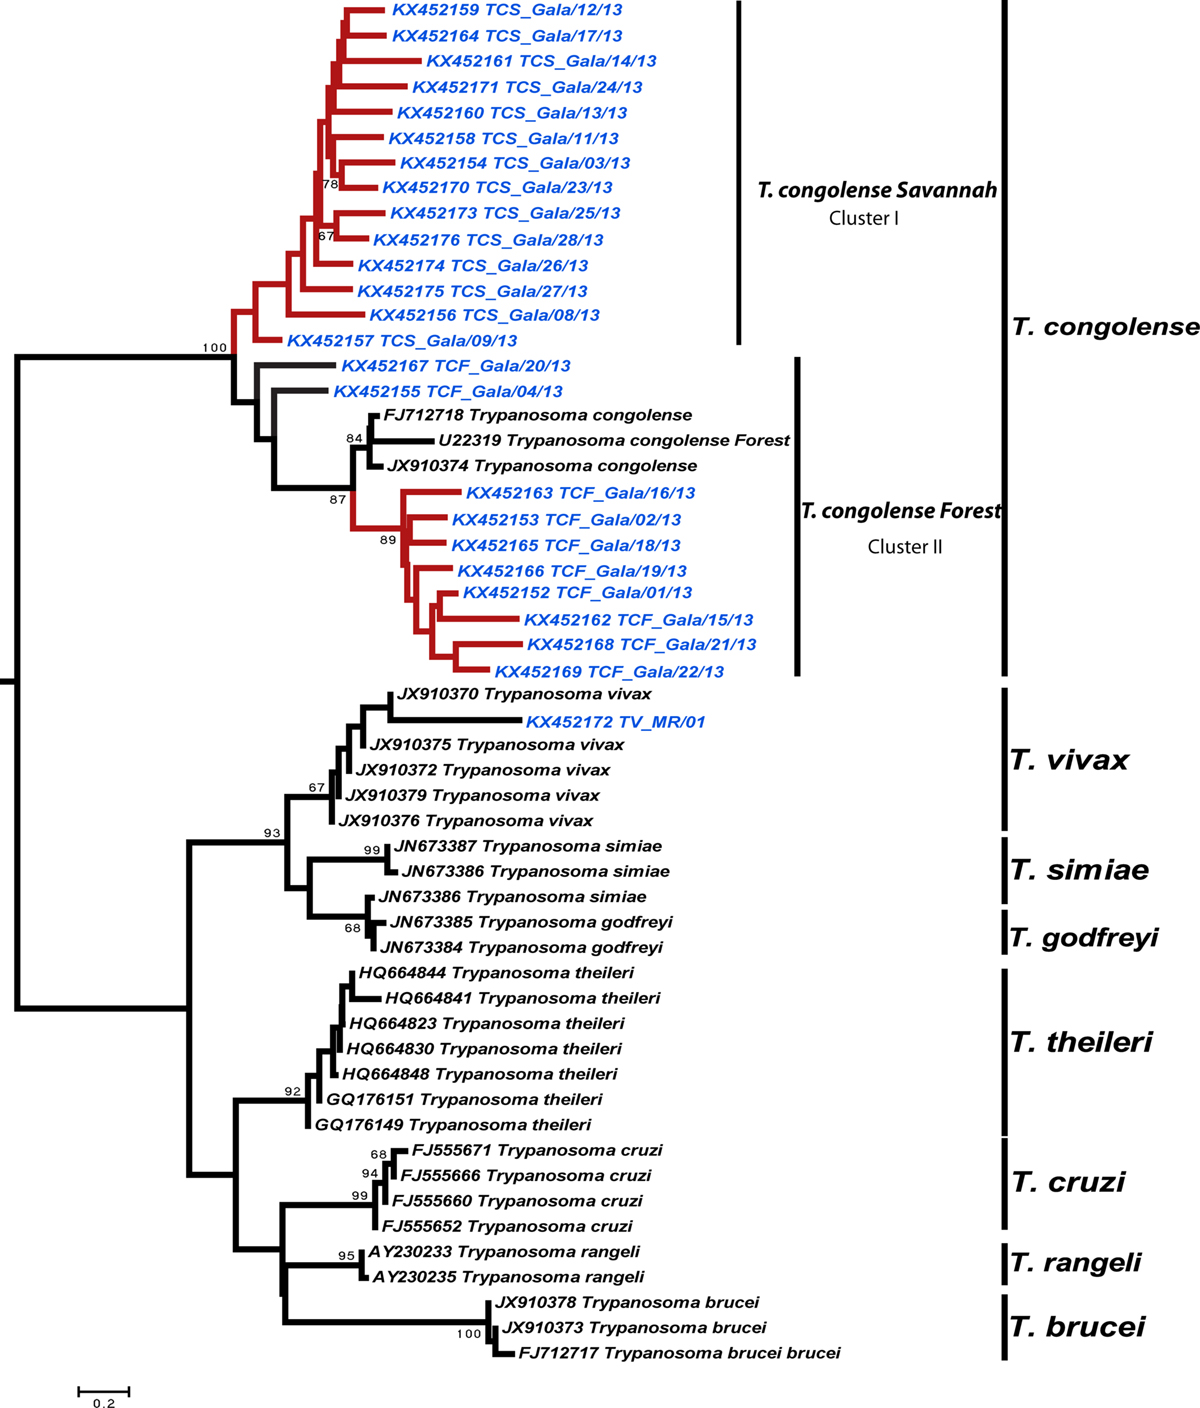
Figure 2.
Download original image
Phylogenetic tree based on partial ITS1 trypanosome sequence analysis . The tree was visualized with FigTree 1.3.1. Bootstrap values are shown to the left of the branch. Bootstrap values are shown where support is >65%. Sequences generated in this study are shown in blue. Sequences retrieved from GenBank are shown in black with their GenBank accession number.
Current usage metrics show cumulative count of Article Views (full-text article views including HTML views, PDF and ePub downloads, according to the available data) and Abstracts Views on Vision4Press platform.
Data correspond to usage on the plateform after 2015. The current usage metrics is available 48-96 hours after online publication and is updated daily on week days.
Initial download of the metrics may take a while.