Open Access
Figure 7.
Download original image
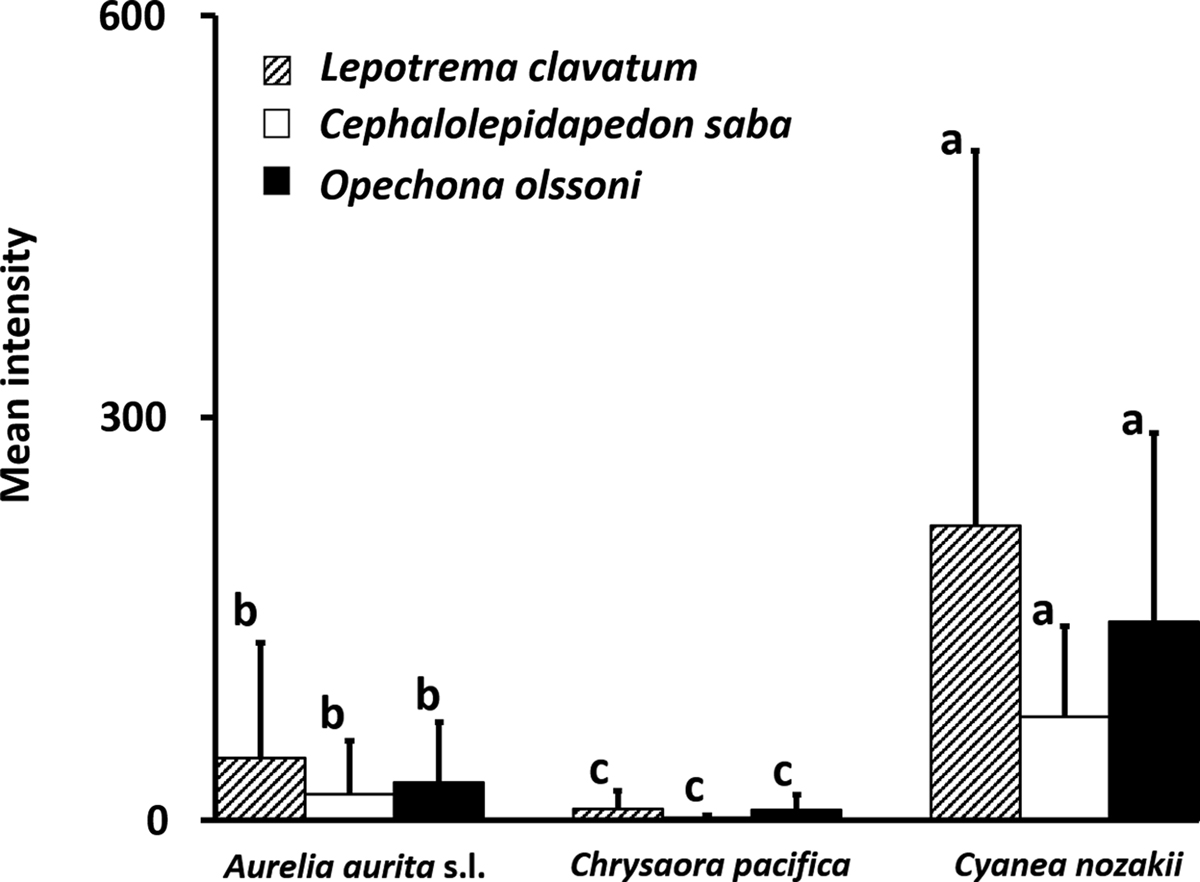
Mean intensity of metacercariae of each species in host jellyfish collected from June 2010 to September 2012. Error bars indicate standard deviations. Different letters denote significant differences among hosts (Steel-Dwass test, p < 0.05).
Current usage metrics show cumulative count of Article Views (full-text article views including HTML views, PDF and ePub downloads, according to the available data) and Abstracts Views on Vision4Press platform.
Data correspond to usage on the plateform after 2015. The current usage metrics is available 48-96 hours after online publication and is updated daily on week days.
Initial download of the metrics may take a while.