Figure 2.
Download original image
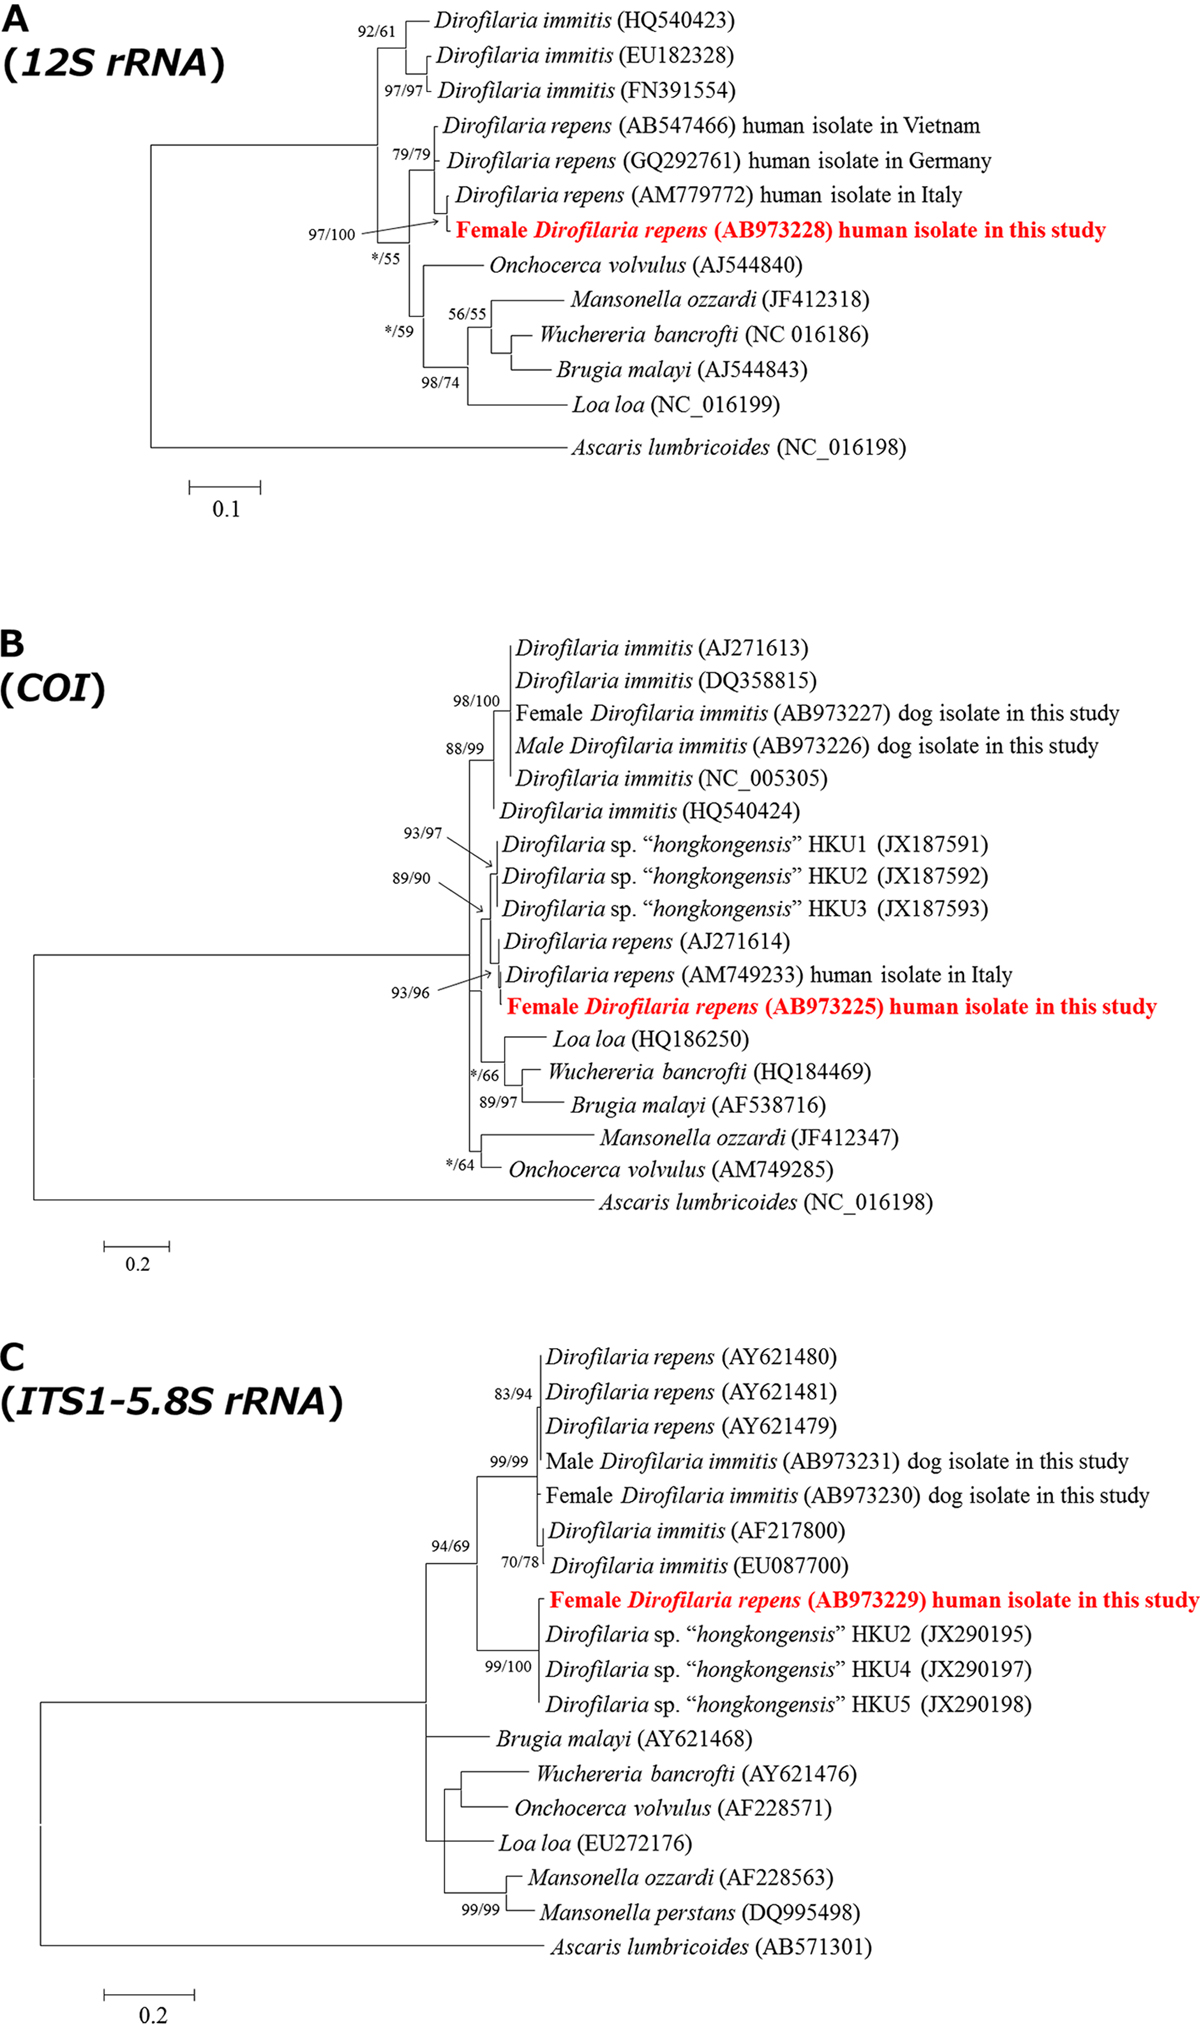
Phylogenetic relationships by maximum likelihood (ML) analysis among sequences of mitochondrial 12S ribosomal RNA (A), mitochondrial cytochrome c oxidase subunit 1 (B) genes, and the internal transcribed spacer 1-5.8S ribosomal RNA region (C). The ML tree was derived from a general time-reversible model using a discrete gamma distribution (+G) with five rate categories and invariant sites (+I). Significant bootstrap support for the ML analysis with 1000 replicates and Bayesian analysis (BI) are shown above the nodes in the order ML/BI. An asterisk indicates <50% support for a node. The scale bar represents the genetic distance in single nucleotide substitutions. GenBank accession numbers are given within parentheses.
Current usage metrics show cumulative count of Article Views (full-text article views including HTML views, PDF and ePub downloads, according to the available data) and Abstracts Views on Vision4Press platform.
Data correspond to usage on the plateform after 2015. The current usage metrics is available 48-96 hours after online publication and is updated daily on week days.
Initial download of the metrics may take a while.