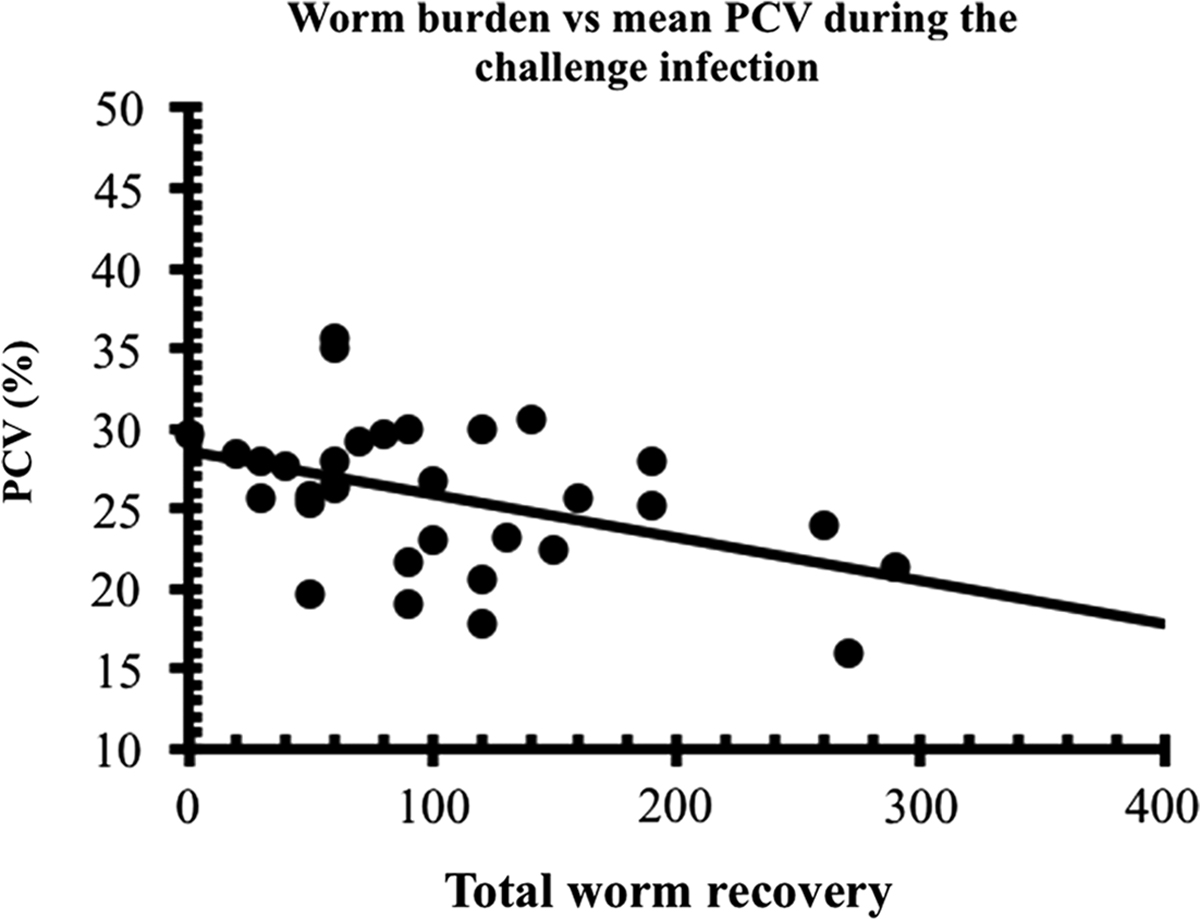
Figure 7.
Download original image
Correlations between total worm burden at necropsy and mean PCV (rs = −0.375, n = 32, P = 0.035) of goats during the challenge infection with H. contortus in the experiment described in the legend to Figure 8. Values from naive controls are excluded from this figure. The best-fit line was calculated by least squares methods and is given only to guide the eye [16].
Current usage metrics show cumulative count of Article Views (full-text article views including HTML views, PDF and ePub downloads, according to the available data) and Abstracts Views on Vision4Press platform.
Data correspond to usage on the plateform after 2015. The current usage metrics is available 48-96 hours after online publication and is updated daily on week days.
Initial download of the metrics may take a while.