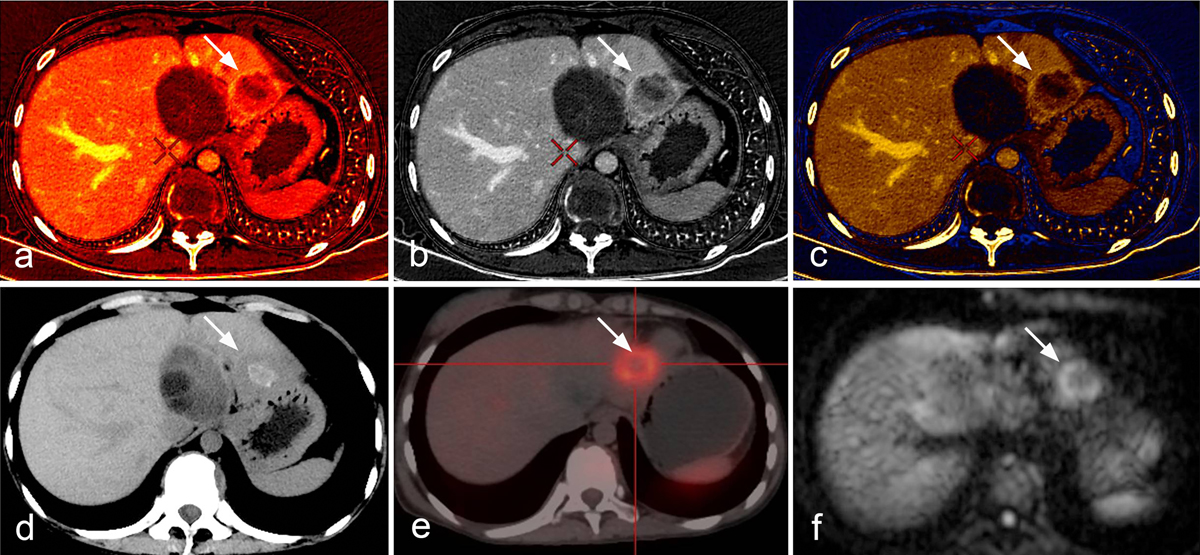
Figure 10.
Download original image
Comparison between spectral CT, PET-CT and MR-DWI images. (a, b, c) The iodine map clearly delineates the well-perfused parts of hepatic alveolar echinococcosis in the marginal zone; (d, e) the enhanced and perfused region of AE in spectral CT was consistent with PET-CT image that displayed high uptake, and (f) MR-DWI that displayed high signal.
Current usage metrics show cumulative count of Article Views (full-text article views including HTML views, PDF and ePub downloads, according to the available data) and Abstracts Views on Vision4Press platform.
Data correspond to usage on the plateform after 2015. The current usage metrics is available 48-96 hours after online publication and is updated daily on week days.
Initial download of the metrics may take a while.