Figure 4.
Download original image
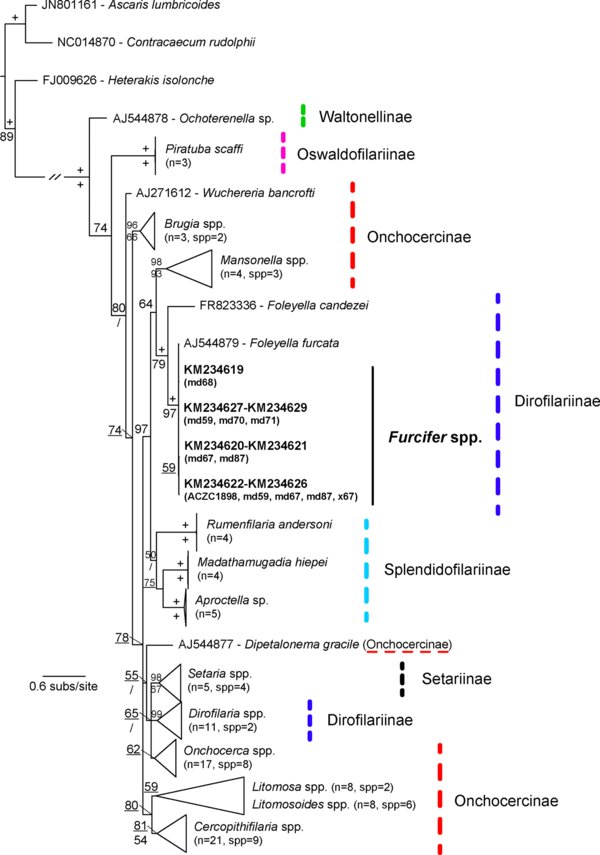
Tree derived from a Bayesian Inference analysis of the nematode COX1 gene sequences. Bayesian Posterior Probability values are given above relevant nodes, and Bootstrap supports for ML analyses below them. The symbol + indicates when support is 100 and / when Maximum Likelihood topology differs. n refers to the number of sequences and spp. refers to the number of species that form the collapsed clade. The new sequences are in bold.
Current usage metrics show cumulative count of Article Views (full-text article views including HTML views, PDF and ePub downloads, according to the available data) and Abstracts Views on Vision4Press platform.
Data correspond to usage on the plateform after 2015. The current usage metrics is available 48-96 hours after online publication and is updated daily on week days.
Initial download of the metrics may take a while.