Open Access
Figure 2.
Download original image
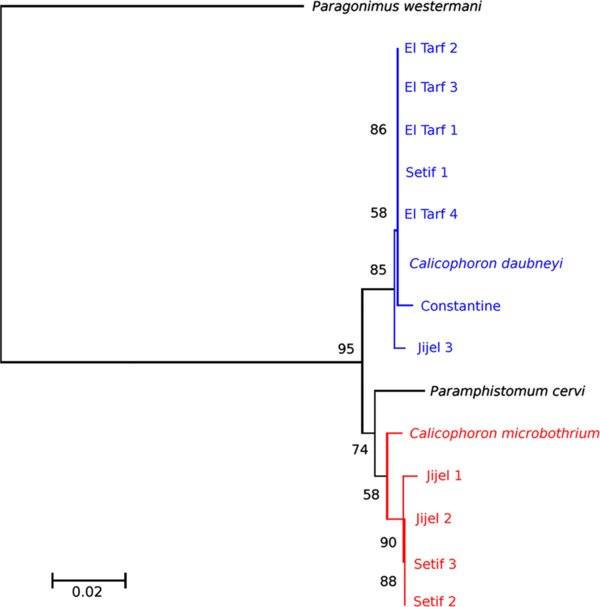
ITS-2 tree based on neighbour-joining estimates with Paragonimus westermani as the outgroup. In blue, clade 1; in red: clade 2. Scale bar indicates the number of substitutions per sequence position.
Current usage metrics show cumulative count of Article Views (full-text article views including HTML views, PDF and ePub downloads, according to the available data) and Abstracts Views on Vision4Press platform.
Data correspond to usage on the plateform after 2015. The current usage metrics is available 48-96 hours after online publication and is updated daily on week days.
Initial download of the metrics may take a while.