Figure 1.
Download original image
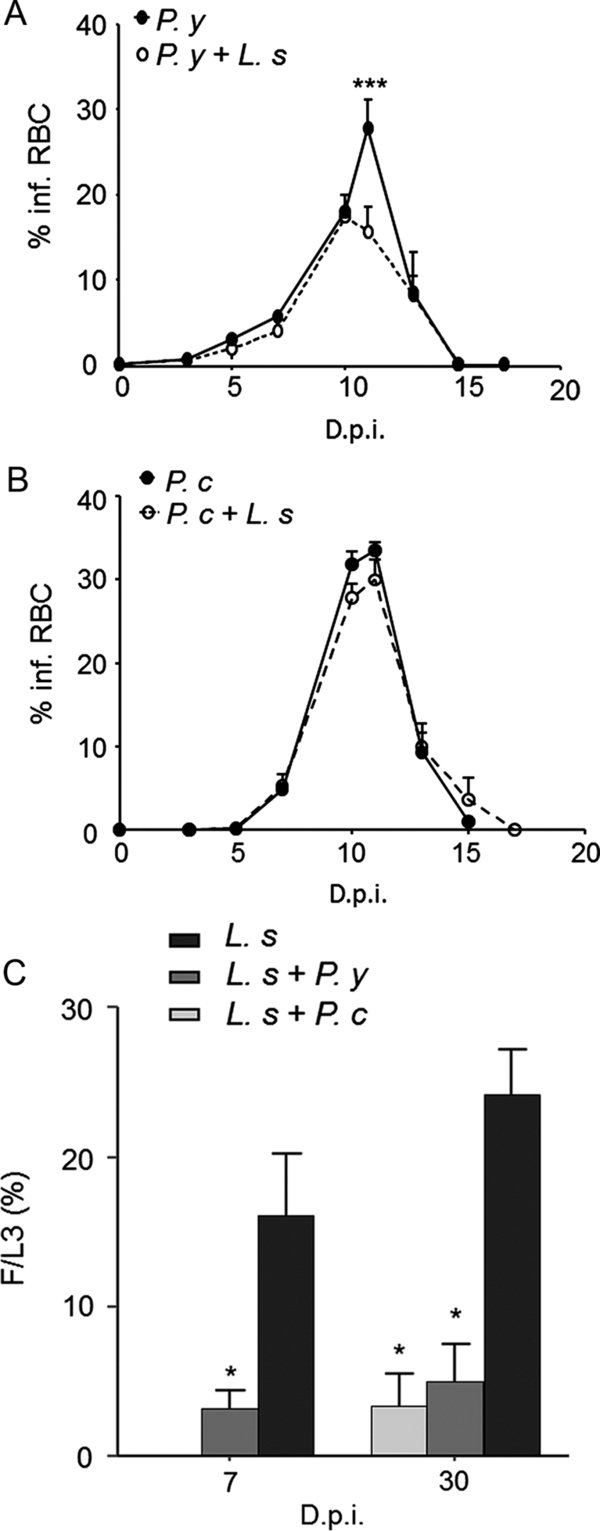
Parasitological monitoring. (A) Parasitaemia of the P. yoelii (P. y) infection in BALB/c mice. Five independent experiments pooled together, carried out with 4–7 mice per group. (B) Parasitaemia of the P. chabaudi (P. c) infection, n = 6 mice per group. % infRBC: Percentage of infected red blood cells; D.p.i.: Days post-inoculation; results are expressed as mean ± SEM; the differences between the mono-infected and co-infected mice with L. sigmodontis (L. s), and the modifications during the time course of the infection were analysed by a two-way analysis of variance. For each analysis the factor group and time effects were significant. The comparison among the groups for each time point was further assessed by Bonferroni’s multiple comparison test. * represents significant differences between the mice infected by P. y and by P. y + L. s (***p < 0.001). (C) Filariae were recovered in the pleural cavity at 7 and 30 days post-inoculation in BALB/c mice; F/L3: recovery rate of filariae, expressed as 100 × number of worms recovered/number of larvae inoculated; D.p.i.: Days post-inoculation; results are expressed as mean ± SEM; n = 6–8; Comparison between the groups of mice infected by L. s only or co-infected with P. y, at day 7, was assessed by a t test (*p < 0.05); at day 30, a one-way analysis of variance revealed a difference between the group of mice infected by L. s only and the mice co-infected both with P. y and P. c (*p < 0.05). The comparison was further assessed by Bonferroni’s test.
Current usage metrics show cumulative count of Article Views (full-text article views including HTML views, PDF and ePub downloads, according to the available data) and Abstracts Views on Vision4Press platform.
Data correspond to usage on the plateform after 2015. The current usage metrics is available 48-96 hours after online publication and is updated daily on week days.
Initial download of the metrics may take a while.