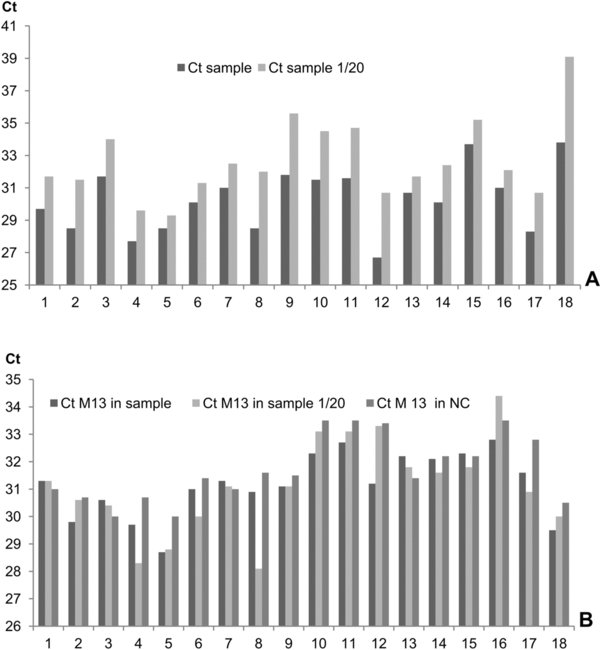
Figure 4.
Download original image
Identification of PCR inhibitors in 18 biological samples positive for Aspergillus. Graph A: Ct values obtained from pure and diluted DNA samples (dilution rate 1/20). Graph B: Ct values obtained with 20 copies of a plasmid DNA systematically added to the same biological samples (undiluted and diluted) and a negative control sample (NC).
Current usage metrics show cumulative count of Article Views (full-text article views including HTML views, PDF and ePub downloads, according to the available data) and Abstracts Views on Vision4Press platform.
Data correspond to usage on the plateform after 2015. The current usage metrics is available 48-96 hours after online publication and is updated daily on week days.
Initial download of the metrics may take a while.